ملف:Thiel-Sen estimator.svg

من أرابيكا، الموسوعة الحرة
اذهب إلى التنقل اذهب إلى البحث

الملف الأصلي(ملف SVG، أبعاده 2٬936 × 3٬075 بكسل، حجم الملف: 37 كيلوبايت)

ملخص

الوصف
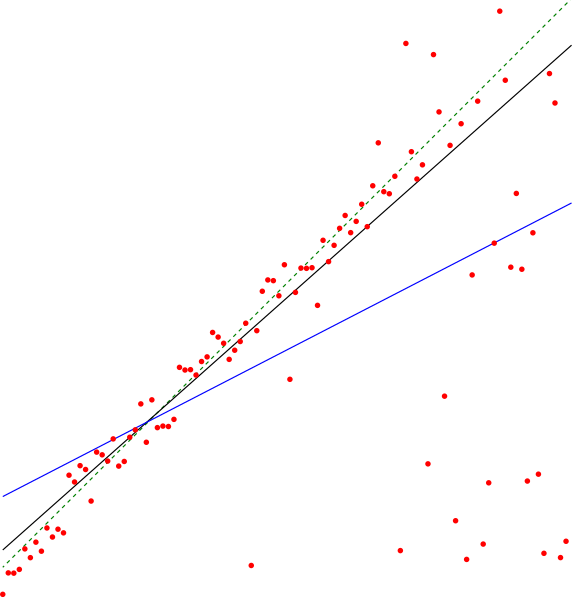
English: The en:Theil–Sen estimator (black line) of a set of sample points, compared to the simple linear regression line (blue). The points were generated by adding a small amount of jitter to points on the green dashed line and then replacing some of the points by random outliers.
التاريخ
المصدر عمل شخصي
المؤلف David Eppstein


ترخيص

أنا، صاحب حقوق التأليف والنشر لهذا العمل، أنشر هذا العمل تحت الرخصة التالية:
Creative Commons CC-Zero هذا الملف متوفر تحت ترخيص المشاع الإبداعي CC0 1.0 الحقوق العامة.
لقد وَضَعَ صاحب حقوق التَّأليف والنَّشر هذا العملَ في النَّطاق العامّ من خلال تنازُلِه عن حقوق العمل كُلِّها في أنحاء العالم جميعها تحت قانون حقوق التَّأليف والنَّشر، ويشمل ذلك الحقوق المُتَّصِلة بها والمُجاورة لها برمتها بما يتوافق مع ما يُحدده القانون. يمكنك نسخ وتعديل وتوزيع وإعادة إِنتاج العمل، بما في ذلك لأغراضٍ تجاريَّةٍ، دون حاجةٍ لطلب مُوافَقة صاحب حقوق العمل.

Source code

This image was created as a pdf file by the following Python code, then converted to SVG.

from pyx import canvas,path,color
from random import random,seed
seed(12345)

N = 103
noise = 10
slope = 1.0

def sample(x):
    y = x * slope
    if random() < (y/N)**3:
        y = random()*N      # outlier
    else:
        y += (random()-0.5)*noise # non-outlier, jitter
    return y

samples = [(i*1.0,sample(i)) for i in range(N)]

c = canvas.canvas()

for x,y in samples:
    c.fill(path.circle(x,y,0.5),[color.rgb.red])

def theilsen(samples):
    N = len(samples)
    def slope(i,j):
        xi,yi = samples[i]
        xj,yj = samples[j]
        return (yi-yj)/(xi-xj)
    
    def median(L):
        L.sort()
        if len(L) & 1:
            return L[len(L)//2]
        else:
            return (L[len(L)//2 - 1] + L[len(L)//2])/2.0
    
    m = median([slope(i,j) for i in range(N) for j in range(i)])
    
    def error(i):
        x,y = samples[i]
        return y - m*x
    
    b = median([error(i) for i in range(N)])
    
    return m,b

m,b = 1,0
c.stroke(path.line(0,b,N,N*m+b),[color.rgb.green])

m,b = theilsen(samples)
c.stroke(path.line(0,b,N,N*m+b),[color.rgb.black])

def slr(samples):
    N = len(samples)
    sumxy = sum([x*y for x,y in samples])
    sumx = sum([x for x,y in samples])
    sumy = sum([y for x,y in samples])
    sumxx = sum([x*x for x,y in samples])
    m = (sumxy - sumx*sumy/N)/(sumxx - sumx**2/N)
    b = sumy/N - m*sumx/N
    return m,b

m,b = slr(samples)
c.stroke(path.line(0,b,N,N*m+b),[color.rgb.blue])

c.writePDFfile("ThielSen")

الشروحات

أضف شرحاً من سطر واحد لما يُمثِّله هذا الملف

العناصر المصورة في هذا الملف

يُصوِّر

David Eppstein الإنجليزية

٣ يوليو 2011

تاريخ الملف

اضغط على زمن/تاريخ لرؤية الملف كما بدا في هذا الزمن.

زمن/تاريخصورة مصغرةالأبعادمستخدمتعليق
حالي22:59، 3 نوفمبر 2011تصغير للنسخة بتاريخ 22:59، 3 نوفمبر 20112٬936 × 3٬075 (37 كيلوبايت)commonswiki>David EppsteinDarker green, thicker lines

ال1 ملف التالي مكررات لهذا الملف (المزيد من التفاصيل):

الصفحة التالية تستخدم هذا الملف: