|
تضامنًا مع حق الشعب الفلسطيني |
ملف:Nearby Stars (14ly Radius).svg

الملف الأصلي (ملف SVG، أبعاده 600 × 600 بكسل، حجم الملف: 92 كيلوبايت)
| هذا ملف من ويكيميديا كومنز. معلومات من صفحة وصفه مبينة في الأسفل. كومنز مستودع ملفات ميديا ذو رخصة حرة. |
| الوصفNearby Stars (14ly Radius).svg |
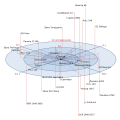
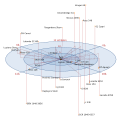
English: A spatial representation of every star within 14 light-years of Sol. There are 32 known stars in this region, including Sol. The stars are coloured according to the spectral type, which may not reflect the actual colour. Please see this Wikipedia article for the listing of stars. If a star is double or triple the stars are shown stacked vertically: the actual position is the star closest to the centre plane. The stars on this map may not all be visible to the naked eye, as many are dwarf stars. Some of this information may be preliminary and not entirely accurate as a result.
The coordinate system is right ascension and declination. Hours of RA are marked, as well as distance in multiples of 5 light-years. |
|||
| التاريخ | ||||
| المصدر |
self-made, Mathematica, Inkscape. See also: http://www.daviddarling.info/encyclopedia/S/starsnearest.html |
|||
| المؤلف | Inductiveload | |||
| الترخيص (إعادة استخدام هذا الملف) |
|
|||
| إصدارات أخرى |
|
|||
| SVG منشأ الملف InfoField | , or with something else.هذا الرسم المتجهي أُنشئ بواسطة Inkscape This diagram uses embedded text that can be easily translated using a text editor.
|
Mathematica Code
raToTheta[{h_, m_, s_}] := 15*h + 15/60*m + 15/3600*s;
decToPhi[{d_, m_, s_}] := 90 - (d + (m/60 + s/3600)*Sign[d]);

(*Returns celestial RA and Dec as radians in spherical coords*)
celestialToSph[{{rah_, ram_, ras_}, {dd_, dm_, ds_}, dist_, name_}] :=
  {
   raToTheta[{rah, ram, ras}] Degree,
   decToPhi[{dd, dm, ds}] Degree,
   dist
   };

(*Map Spherical coords to Cartesian*)
sphereMap[{phi_, theta_, r_}] :=
  {
   r*Sin[theta] Cos[phi],
   r*Sin[theta] Sin[phi],
   r*Cos[theta]};

(*Produce a circle of radius r offset in the z axis by z*)
offsetCircle[r_, z_] := ParametricPlot3D[
   {r*Cos[t],
    r*Sin[t],
    z},
   {t, 0, 2 Pi}];

(*Star list as {RA},{Dec},Distance,Name}*)
starList =
  {
   {{0, 0, 0}, {0, 0, 0}, 0, "Sun"},
   {{14, 29, 43}, {-62, 40, 46}, 4.2421, "Proxima Centauri"},
   {{14, 39, 36.5}, {-60, 50, 02}, 4.3650, "\[Alpha] Centauri"},
   {{17, 39, 35.1}, {4, 41, 36}, 5.9630, "Barnard's Star"},
   {{10, 49, 18.7}, {-53, 19, 10}, 6.5880, "Luhman 16"},
   {{10, 56, 29.2}, {7, 0, 53}, 7.7825, "Wolf 359"},
   {{11, 3, 20.2}, {35, 58, 12}, 8.2905, "Lalande 21185"},
   {{6, 45, 8.8}, {-16, 42, 58}, 8.5828, "Sirius"},
   {{1, 39, 1.3}, {-17, 57, 01}, 8.7280, "Luyten 726-8"},
   {{15, 41, 51.5}, {-22, 50, 25}, 9.3000, "Wise 1541-2250"},
   {{18, 49, 49.4}, {-23, 50, 10}, 9.6183, "Ross 154"},
   {{23, 41, 54.7}, {44, 10, 30}, 10.322, "Ross 248"},
   {{3, 32, 55.8}, {-9, 27, 30}, 10.522, "\[Epsilon] Eridani"},
   {{23, 5, 52}, {-35, 51, 11}, 10.742, "Lacaille 9352"},
   {{11, 47, 44.4}, {0, 48, 16}, 10.919, "Ross 128"},
   {{22, 38, 33.4}, {-15, 18, 7}, 11.266, "EZ Aquarii"},
   {{07, 39, 18.1}, {5, 13, 30}, 11.402, "Procyon"},
   {{21, 06, 53.9}, {38, 44, 58}, 11.403, "61 Cygni"},
   {{18, 42, 46.7}, {59, 37, 49}, 11.525, "Struve 2398"},
   {{1, 18, 22.9}, {44, 1, 23}, 11.624, "Groombridge 34"},
   {{22, 3, 21.7}, {-56, 47, 10}, 11.824, "\[Epsilon] Indi"},
   {{8, 29, 49.5}, {26, 46, 37}, 11.826, "DX Cancri"},
   {{1, 44, 4.1}, {-15, 56, 15}, 11.887, "\[Tau] Ceti"},
   {{3, 35, 59.7}, {-44, 30, 45}, 11.991, "GJ 1061"},
   {{1, 12, 30.6}, {-16, 59, 56}, 12.132, "YZ Ceti"},
   {{07, 27, 24.5}, {5, 13, 33}, 12.366, "Luyten's Star"},
   {{2, 53, 0.9}, {16, 52, 53}, 12.571, "Teegarden's Star"},
   {{18, 45, 5.3}, {-63, 57, 48}, 12.571, "SCR 1845-6357"},
   {{5, 11, 40.6}, {-45, 1, 6}, 12.777, "Kapteyn's Star"},
   {{21, 17, 15.3}, {-38, 52, 03}, 12.870, "Lacaille 8760"},
   {{22, 27, 59.5}, {57, 41, 45}, 13.149, "Kruger 60"},
   {{10, 48, 14.7}, {-39, 56, 06}, 13.167, "DEN 1048-3956"},
   {{6, 29, 23.4}, {-2, 48, 50}, 13.349, "Ross 614"}
     };

(*Get stars in {phi, theta, r} format*)
starsDeg = Map[celestialToSph, starList, 1];
(*Map into the Cartesian space*)
starPlot = sphereMap /@ starsDeg;
stars = ListPointPlot3D[starPlot];
labels = Table[
   Graphics3D[
    Text[
     starList[[i, 4]],
     starPlot[[i]],
     {-1.1, 0}
     ]],
   {i, 1, Length[starList]}];
posLines = Table[
   Graphics3D[{Orange,
     Line[
      {{0, 0, 0},
       {starPlot[[i, 1]], starPlot[[i, 2]], 0},
       starPlot[[i]]}
      ]}],
   {i, 2, Length[starList]}];
gridhours = Graphics3D[
   {Line[{{-20, 0, 0}, {20, 0, 0}}],
    Line[{{0, -20, 0}, {0, 20, 0}}]}];
gridly = {offsetCircle[5, 0],
   offsetCircle[10, 0],
   offsetCircle[15, 0]};
viewDist = 20000; (*Distance of Viewpoint*)
viewRA = 225 Degree; (*RA of viewpoint*)
viewDec = 20 Degree;(*Dec of viewpoint*)
Show[
 labels,
 posLines,
 stars,
 gridhours,
 gridly,

 BaseStyle -> {FontFamily -> "DejaVu Sans"},
 PlotRange -> {{-15, 15}, {-15, 15}, {-12, 12}}
{{QualityImage}},
 SphericalRegion -> True,
 Axes -> False,
 BoxRatios -> {1, 1, 1},
 Boxed -> False,
(*ViewPoint -> {Sin[viewRA]*viewDist, Cos[viewRA]*viewDist,
   Sin[viewDec]*viewDist},*)
 (*ViewVertical -> {0, 0, 1},*)
 AxesLabel -> {"x", "y", "z"},
 ImageSize -> 1000]
الشروحات
قيمة ما بدون عنصر ويكي بيانات
٦ أبريل 2008
تاريخ الملف
اضغط على زمن/تاريخ لرؤية الملف كما بدا في هذا الزمن.
| زمن/تاريخ | صورة مصغرة | الأبعاد | مستخدم | تعليق | |
|---|---|---|---|---|---|
| حالي | 00:08، 7 أبريل 2008 |  | 600 × 600 (92 كيلوبايت) | commonswiki>Inductiveload | {{Information |Description=A spatial representation of every star within 14 light-years of en:Sol. There are 32 stars in this region, including Sol. The stars are coloured according to the spectral type, which may not reflect the actual colour. Plea |
استخدام الملف
ال1 ملف التالي مكررات لهذا الملف (المزيد من التفاصيل):
- ملف:Nearby Stars (14ly Radius).svg من ويكيميديا كومنز
ال3 صفحات التالية تستخدم هذا الملف:


